Prometheus
PostgreSQL
監控
Prometheus 監控 PostgreSQL server 實作
2019/01/29 14:51:39
3
4658
1. Prometheus postgres_exporter 簡介
在公司的 lab 安裝了 Prometheus server 將 k8s cluster 納入監控之後,接著,我們要按以下的實作步驟,將 lab 裡的 PostgreSQL server 也一併納入 Prometheus server 的監控範圍。
根據 Promtheus 上的 Exporters and Integrations 頁面 所載,Prometheus 有釋出給 PostgreSQL server 所用的 exporter ,也就是 postgres_exporter 。本文即是根據 postgres_exporter 上的指示,在我們 lab 的 PostgreSQL server 上的實作步驟。
2. 環境說明
本文的實作環境如下:
| Hostname | IP | 說 明 | |
| Prometheus server | caai4 | 192.168.1.144 | Red Hat 7.4 |
| PostgreSQL server | caai3 | 192.168.1.143 |
Red Hat 7.4
PostgreSQL 9.5.13
|
lab 的 PostgresSQL server 是直接安裝在 VM 主機上的,接下來會先使用 golang 編譯
postgres_exporter ,然後再啟動 postgres_exporter 納入 Prometheus 的監控,完整步驟如 3. 實作 裡所述。
3. 實作
3.1 使用 Golang 編譯 postgres_exporter
因為公司的環境都沒有安裝 golang,先按照以下的步驟來安裝 golang
1. 下載 go: 到 https://golang.org/dl/ 下載 go1.11.5.linux-amd64.tar.gz
# wget https://dl.google.com/go/go1.11.5.linux-amd64.tar.gz
2. 解開到 /usr/local
# tar zxvf go1.11.5.linux-amd64.tar.gz -C /usr/local
3. 修改 PATH 環境變數
# export PATH=$PATH:/usr/local/go/bin
4. 下載 postgres_exporter
# go get github.com/wrouesnel/postgres_exporter
5. 編譯 postgres_exporter binary
# cd /root/go/src/github.com/wrouesnel/postgres_exporter
# go run mage.go binary
編譯出來的 postgres_exporter 會位於 /root/go/src/github.com/wrouesnel/postgres_exporter/bin/postgres_exporter_v0.4.7_linux_amd64 目錄下
3.2 在 PostgreSQL server 上安裝 postgres_exporter
1. 將 postgres_exporter copy 到 /usr/local/bin 下
# cp /root/go/src/github.com/wrouesnel/postgres_exporter/bin/postgres_exporter_v0.4.7_linux_amd64/postgres_exporter /usr/local/bin
2. 設定 DATA_SOURCE_NAME 環境變數
寫法為 postgresql://DB_USER_NAEM:PASSWORD@DB_HOST:DB_PORT/DBNAME?sslmode=disable
其中,若不使用 SSL,請指定 sslmode=disable,否則不加這一段
# export DATA_SOURCE_NAME="postgresql://DB_USER_NAME:PASSWORD@DB_HOST:DB_PORT/DB_NAME?sslmode=disable"
3. 設定好 DATA_SOURCE_NAME 環境變數後,就可以啟動 postgres_exporter 了
# /usr/local/bin/postgres_exporter
啟動後,postgres_exporter 會 listen 9187 port
3.2 在 Prometheus server 上新增 postgres_exporter target
postgres_exporter 啟動後,就可以將它納入 Prometheus 監控的 target 了。修改 /etc/prometheus.yaml,加入以下的部份
## postgresql
  - job_name: 'postgres_exporter'

    static_configs:
    - targets:
      - '192.168.1.143:9187'
加入後,restart prometheus
# systemctl restart prometheus
重新啟動後,以 # systemctl status -l prometheus
確認是否有錯誤
3.3 在 Grafana 上新增 dashboard
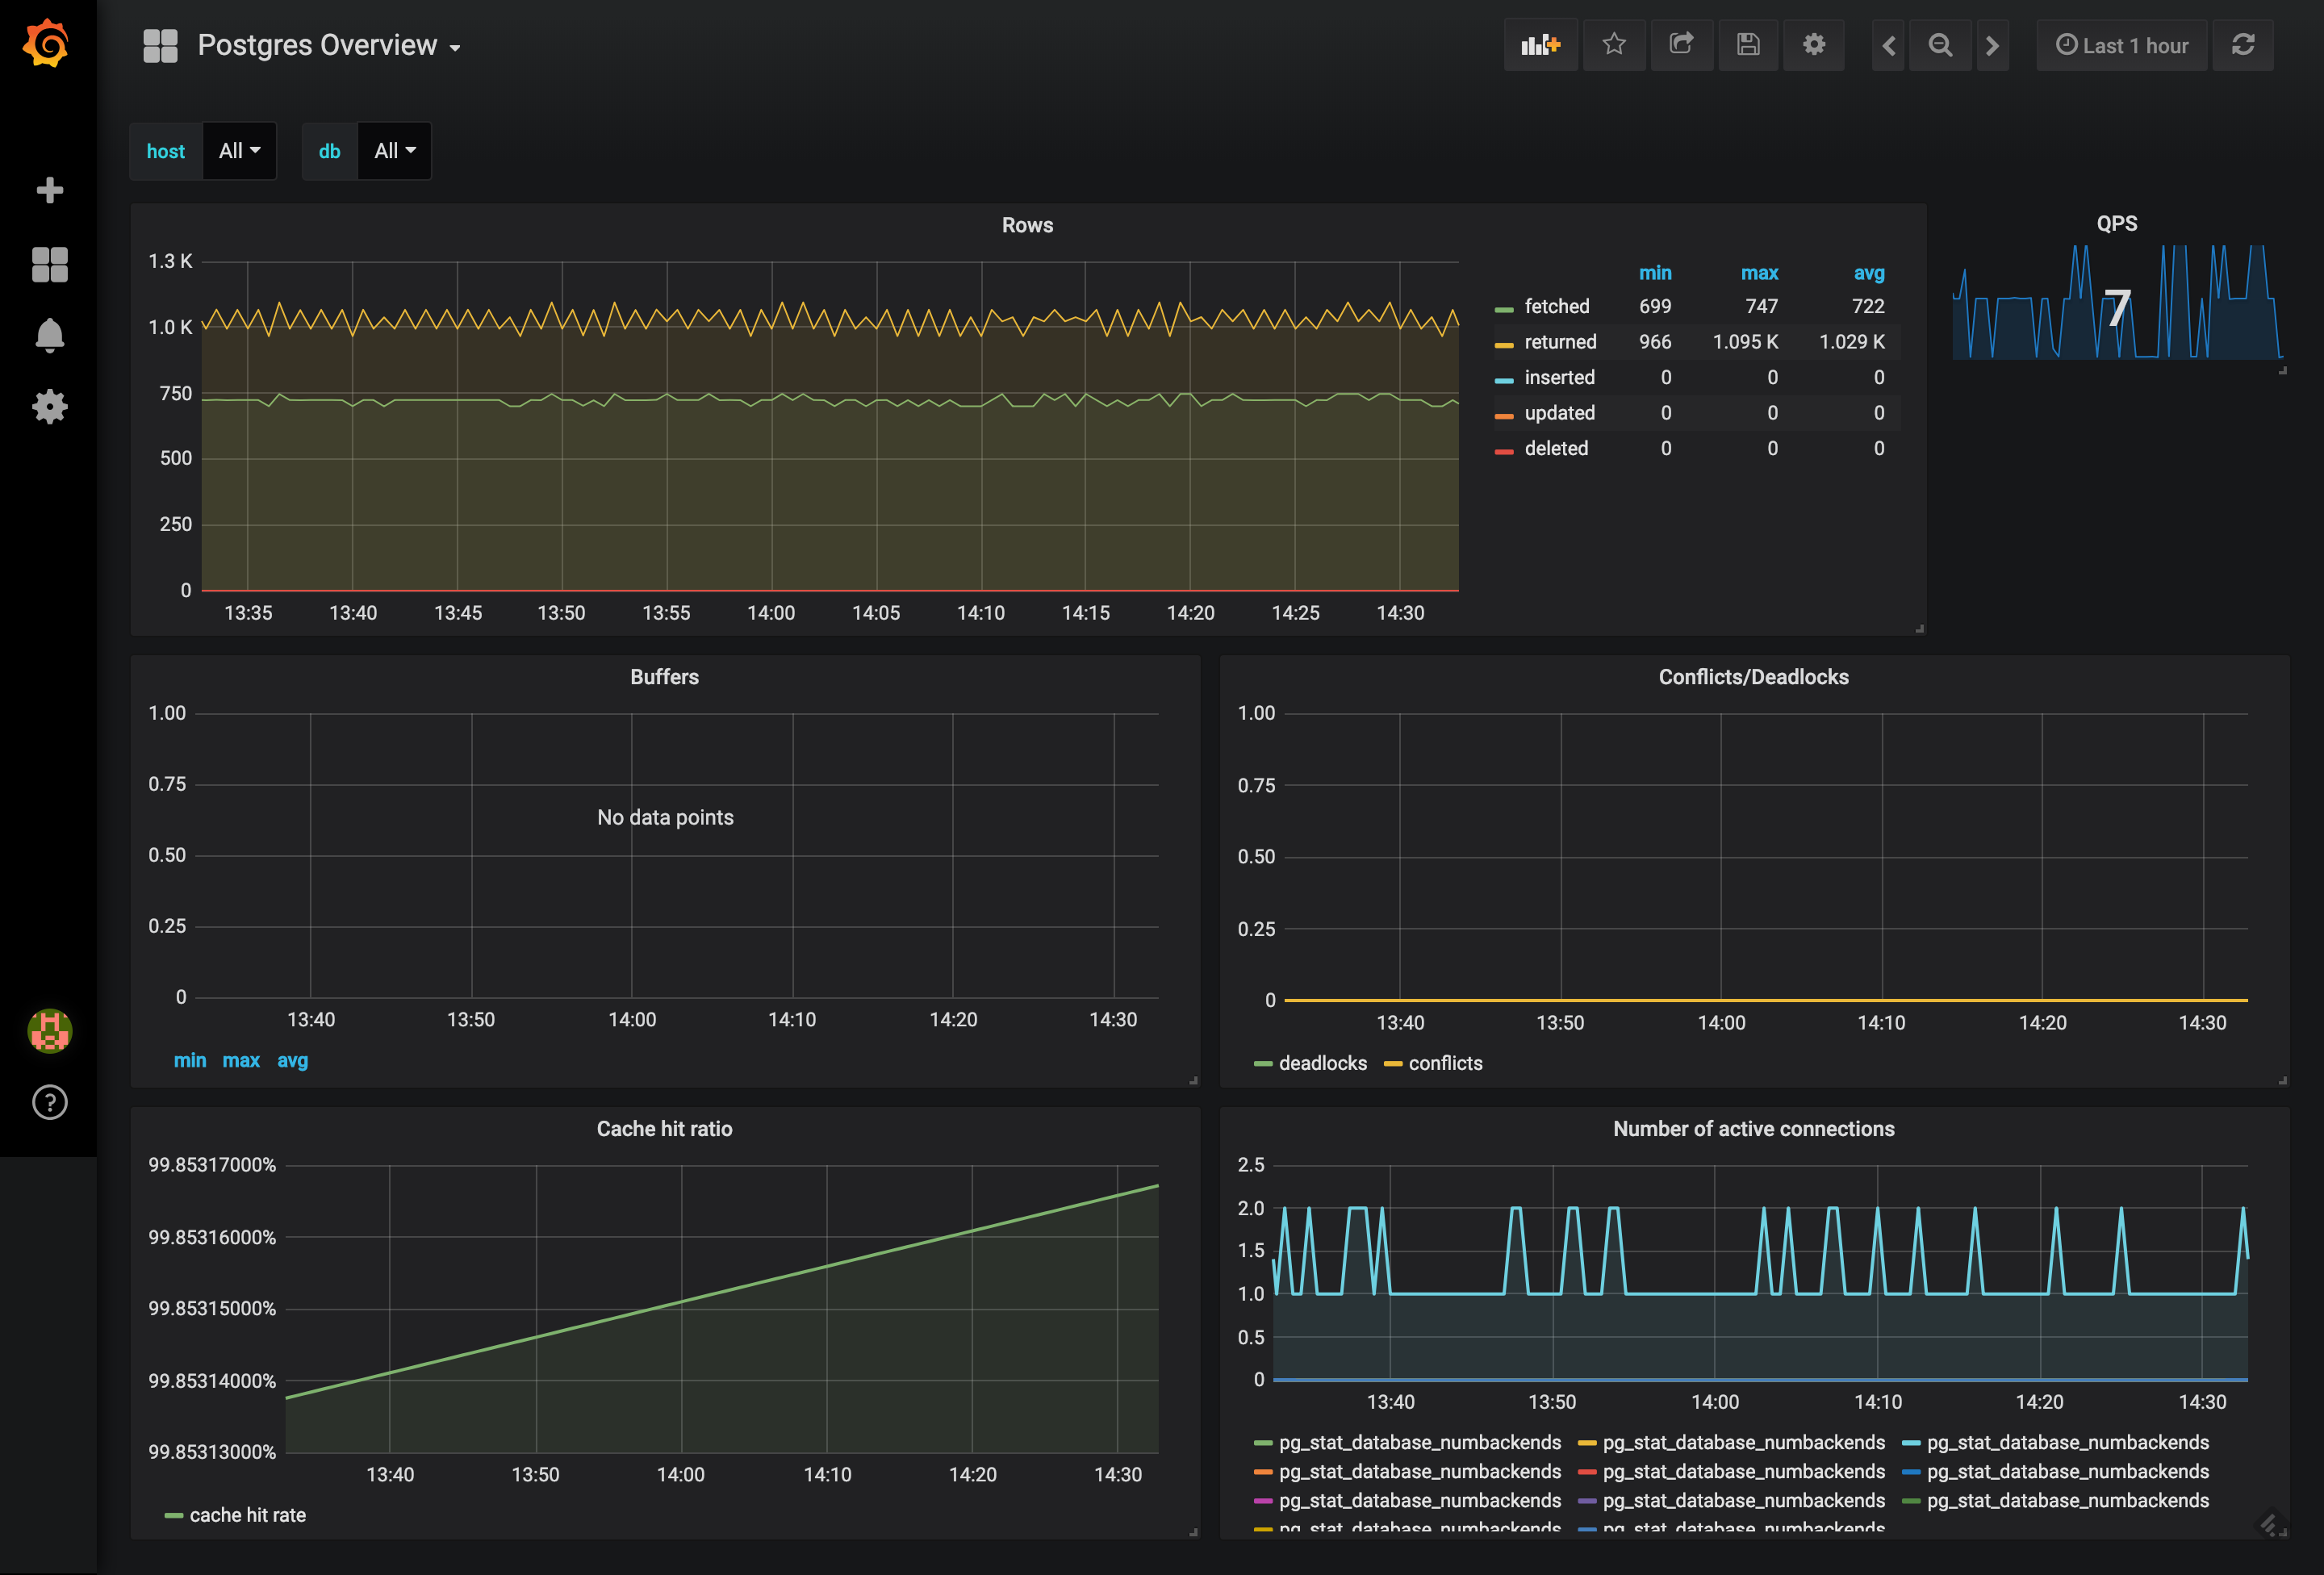
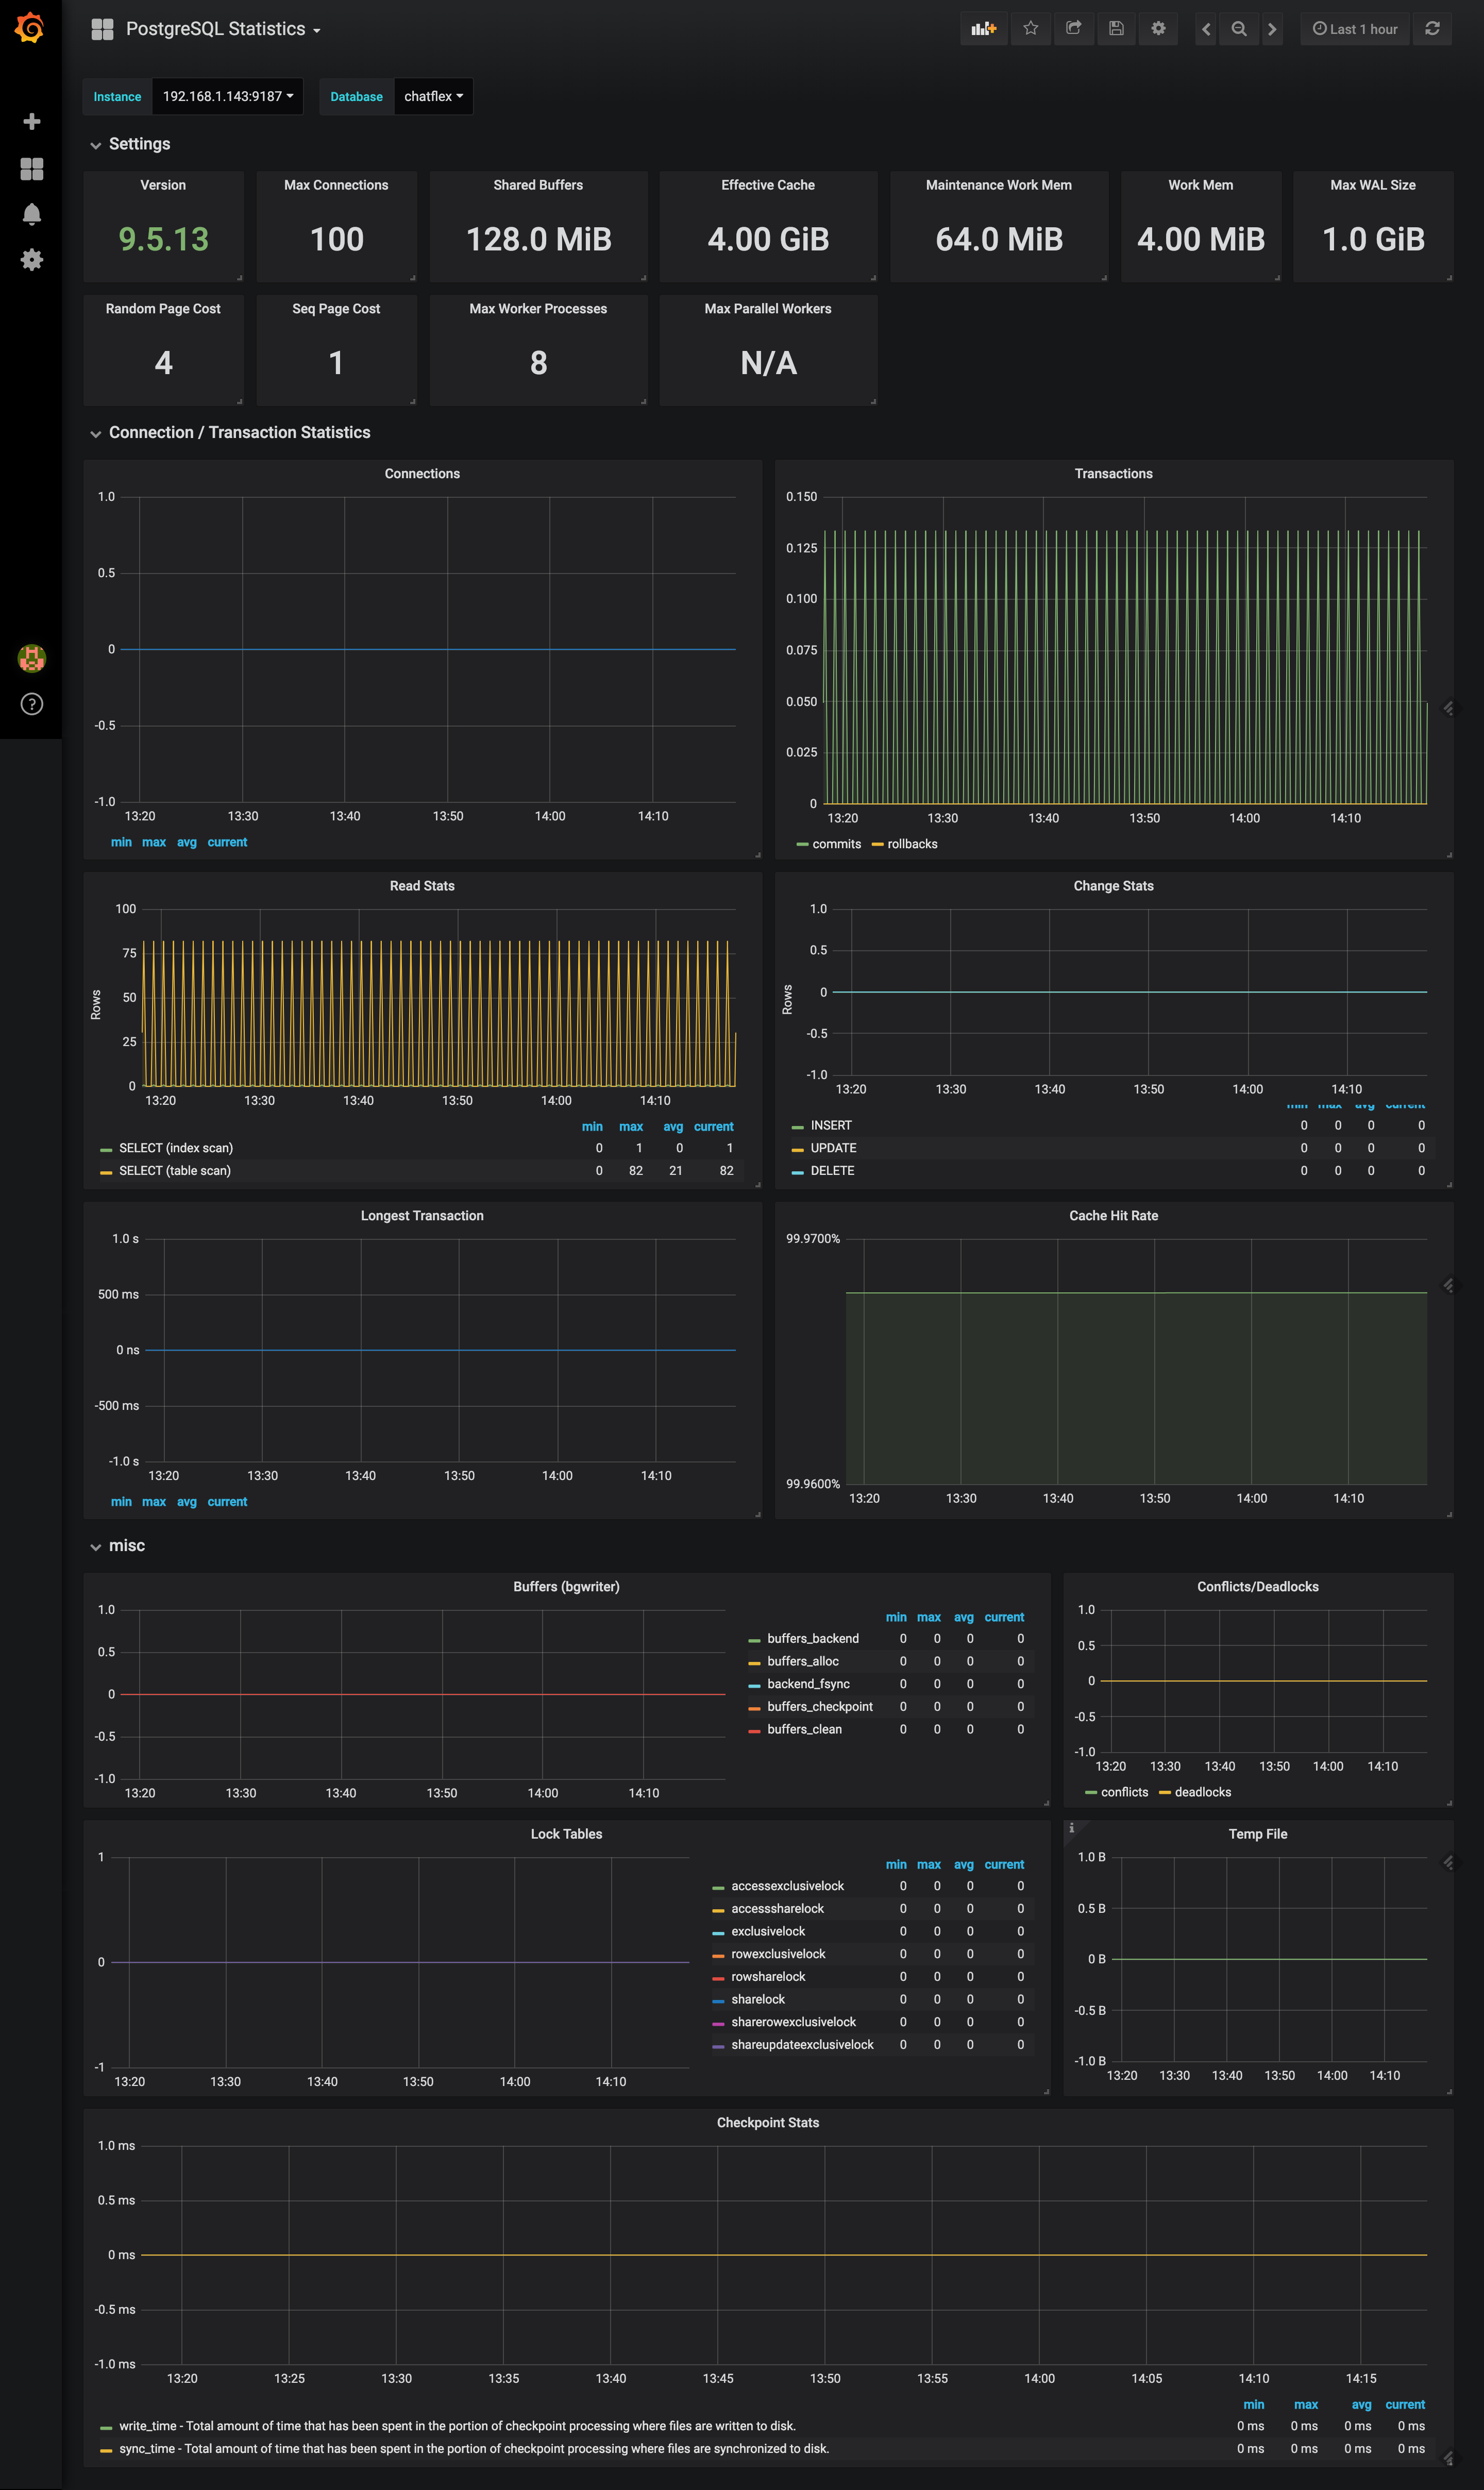
最後,在 Grafana 上新增用來展示 postgres_exporter metrics 的 dashboard 就大功告成了
以下是 PostgreSQL overview 以及
Dashboard : Postgres Overview,
Grafana Labs 455
Dashboard: PostgreSQL Statistics,Grafana Labs 6742
4. 參考資料
PostgreSQL Server Exporter : https://github.com/wrouesnel/postgres_exporter#postgresql-server-exporter
Ben Yao
2019/03/06 13:01:34
Very useful
Ming Ren
2019/04/15 15:34:49
nice article!